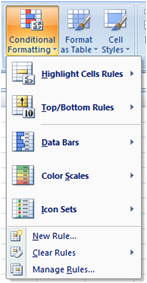
 Conditional formatting can be used to have Excel determine whether or not something falls within a specific guideline. Say for instance that you want to track when someone needs retested, you could have the cell change color automatically depending on criteria. The Conditional Formatting button is found on the Home Tab. It has some prebuilt functionality, however if you need to you can create your own rules.
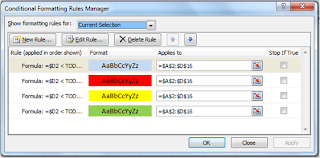
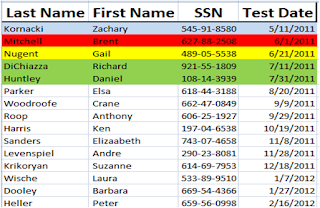
Conditional formatting for the example is as follows:
Notice the first line of the text is blue. This has a conditional format associated with it that shows all the dates before 5/12/11 with a blue background.


In order for us to show all of the information with the blue we need to be careful how we write the formula inside of the conditional formatting dialog. Also, the placement of each rule is important here due to the fact that if I have the rules listed out of order the colors will be off. For instance f I have the rule for 90 days out at the top all of the highlighted areas would be green not the rainbow as above.
If for some reason the formatting does not look correct on the Excel work sheet, when you have finished. It could be due to the fact that the Conditions are out of order, reopen the Conditional Formatting rules and make sure that the rule with the lowest value is at the top. Another possibility is that the Cancel button was hit instead of the Apply or OK buttons.
 If for some reason the Blue does not
appear open the Condition Formatting Rules and move the blue rule up by using
the arrows. These conditional formatting
rules should be at the bottom of the list.
We can move them by using the arrows in the upper right hand section of
the Condition Formatting Rules Manager,
see below.
Using the Today Function
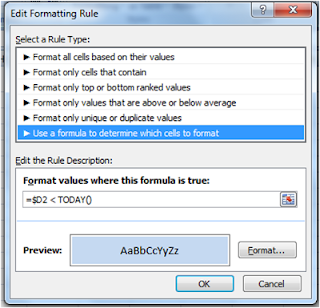
We will use the today function and compare it to cell D2 to
get the required color. In this case the
formula would read; =$D2 < Today().
The next rule would be; =&D2 <
Today()+30. The third rule would be;
=$D2 < Today()+60, and the last
one is; =$D2 < Today()+90.
To conditionally format a single column of dates looking for
30, 60, and 90 days out. Select the
column header and go to the Conditional
Formatting button, choose Manage
Rules this will bring a dialog box up that we can use to create many
different rules. Click the New Rule button, another dialog box
will appear. Choose Format only cells that contain and fill in the information in the
first dialog =Today() and the second
dialog =Today()+30 this will select
a date range for the next 30 days.
Format the cell fill color to red.
For the range of 60 days out we will want to make a second
rule, click the New Rule button,
another dialog box will appear. Choose Format only cells that contain and fill
in the information in the first dialog =Today()+31
and the second dialog =Today()+60 this
will select a date range for the next 30 days.
Format the cell fill color to yellow.
For the range of 90 days out we will want to make a second
rule, click the New Rule button,
another dialog box will appear. Choose Format only cells that contain and fill
in the information in the first dialog =Today()+61
and the second dialog =Today()+90 this
will select a date range for the next 30 days.
Format the cell fill color to green.
Alternating Cell Color
 In order to create alternating row
colors that will not move when sorted we can use conditional formatting. These conditional formatting rules should be
at the bottom of the list. We can move
them by using the arrows in the upper right hand section of the Condition Formatting Rules Manager, see
below
If you wish to have alternating row colors, using
conditional formatting, see image to the left.
We need to select the area that we wish to have the alternating lines of
color. I have chosen columns A to F and
rows 1 to 19.
We need to go in to the conditional formatting Manage Rules and choose Use a formula to determine which cells to
format.
=mod(row(),2)=1
The =mod() means
that we want to modify something, the selected area.
The row() or rows
are what we are modifying.
The 2 tells Excel
how many rows we are going to alternate the cell colors, see the example
above. Every two rows are colored.
The =1 tells Excel
where to start the colorizing, in this case I started at row 1. Our choices ore 0 (Zero) or 1, 0 starts at
row 2 and 1 starts at row 1.


![Validate my Atom 1.0 feed [Valid Atom 1.0]](valid-atom.png)
No comments:
Post a Comment